 | Features and Benefits
|
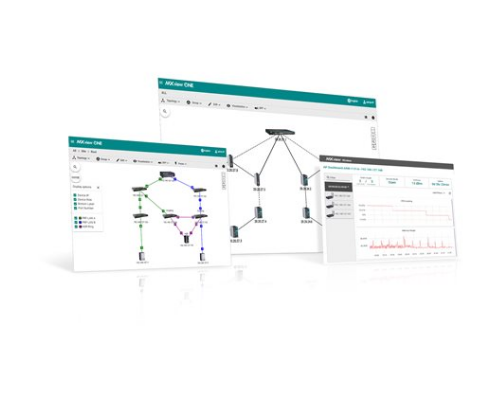
Moxa’s MXview One next-generation network management software is designed for monitoring and diagnosing networking devices in industrial networks. MXview One provides an integrated management platform that can discover networking devices and SNMP/IP devices installed on subnets. All selected network components can be managed via a web browser from a local site or through remote access—anytime and anywhere.
In addition, MXview One supports the optional MXview Wireless and MXview Power add-on modules. MXview Wireless provides additional advanced functions for wireless applications to monitor and troubleshoot your network, and help you minimize downtime. MXview Power provides additional advanced functions for power applications based on IEC 61850 to monitor and troubleshoot substation networks in real-time.
Discovers up to 2,000 Moxa devices and SNMP/ICMP devices within scan range
Visualization of redundant link status and device roles of network redundancy protocols
Security view for the security status of network devices with industrial security standard
A network management dashboard to view the network status quickly
Visualization of network traffic loading with color-coded links
Visualization of managed PoE device power consumption
SFP list for fiber check
Wireless device dashboard that shows dynamic AP-client relationships and performance indicator charts for wireless devices
Roaming playback to review a client's roaming status
PRP/HSR visualization for power applications compliant with IEC-61850
MMS protocol to identify related IED devices
Detect problems in real-time with SNMP trap/inform, or periodic polling
Generate trend graphs to track bandwidth utilization and error packet rate statistics, accurate to four decimal places
Supports Syslog server for centralized message management
Configurable event notification alarms sent through email
Multiple options for events with self-defined threshold and duration
Real-time device availability monitoring
Provides RESTful API and web widget for integrating MXview One into the existing system
Generate an inventory report for each device on the network
Compile comprehensive device properties report
Manage device firmware from a single platform
In one click, back up the configuration of multiple devices and the entire MXview One database, including topology, job scheduling, events, and device properties
Scheduling for periodic configuration backup
Save history of configuration changes
Comparison tool for checking differences between two configurations
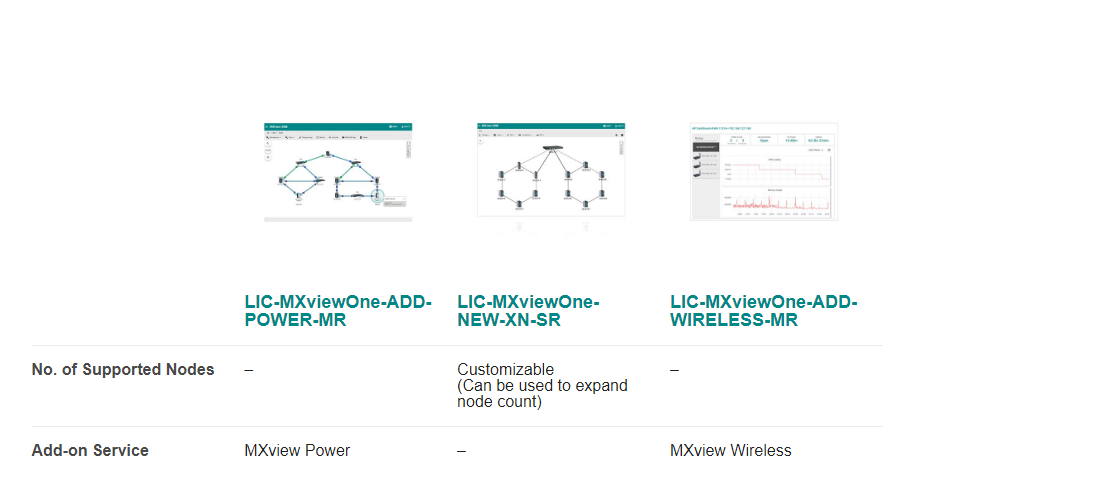
Demand-based licenses to increase node limit for monitoring
Optional MXview Power and MXview Wireless add-on licenses to unlock advanced functions
![]()
Need support, click here